

Beware the savings gap!
The long term cost of holding cash
Back in March, I wrote about the elevated level of cash holdings that many individual investors hold in various parts of the world. I noted 50% cash holding as a percentage of household assets in Japan, as well as 30% cash holdings in the EU.
Since my earlier note, we have experienced ‘Liberation Day’ - Donald Trump's historic announcement of economic tariffs on April 2 this year, which saw US stock markets slide as investors frantically sold stocks. Despite the noise, those who bought instead of selling would have seen an investment in the S&P 500 deliver 6.5% performance since Liberation Day*.
*as June 10, 2025
The market turmoil that immediately followed Liberation Day is yet another example of how psychology can play a detrimental role in client journeys. This might explain why such large levels of cash holdings are prevalent in many markets globally – ultimately preventing investors from achieving their investment goals.
In this article, I aim to delve a little deeper into how high cash savings, whilst offering an encouraging sign of wealth, can be detrimental to investors over the long term, particularly if they have high savings needs overall.
What is the savings gap?
It is estimated that European retail investors hold around 36% of their money in the stock market
Now you may be asking: does it matter how much exposure households have to the stock market – surely the most important point is that they’re saving? The key to answering this question is in the savings gap (the difference between the amount of savings needed for a comfortable retirement and the actual savings accumulated by individuals).
In 2019, a Japanese Financial Services Agency (FSA) panel report stated that the average elderly couple will need around ¥20 million ($134,000) to fund a 30 year post-retirement life, based on average monthly expenditure of approximately ¥263,000
American adults, on the other hand, say they need approximately $1.46 million to retire (!) according to a Northwestern Mutual 2024 Planning & Progress Study. This again flags up a significant savings gap, as the Northwestern Mutual survey also found the average worker has less than $89,000 saved for retirement
The conclusion here is that investors will need to invest more and need to generate higher returns on their savings to support their future lives.
Opportunity cost
Given the need for higher returns for our savings, the opportunity cost (the potential gains an investor misses out on when choosing one asset over another) of holding cash relative to other investible asset classes should be explored.
How does opportunity cost work? Using a simple example – if an investor holds $100,000 in cash earning a 3% annual return instead of investing in an asset yielding 10%, the opportunity cost is 7% per year. Over time, this opportunity cost can compound significantly, leading to substantial missed investment gains.
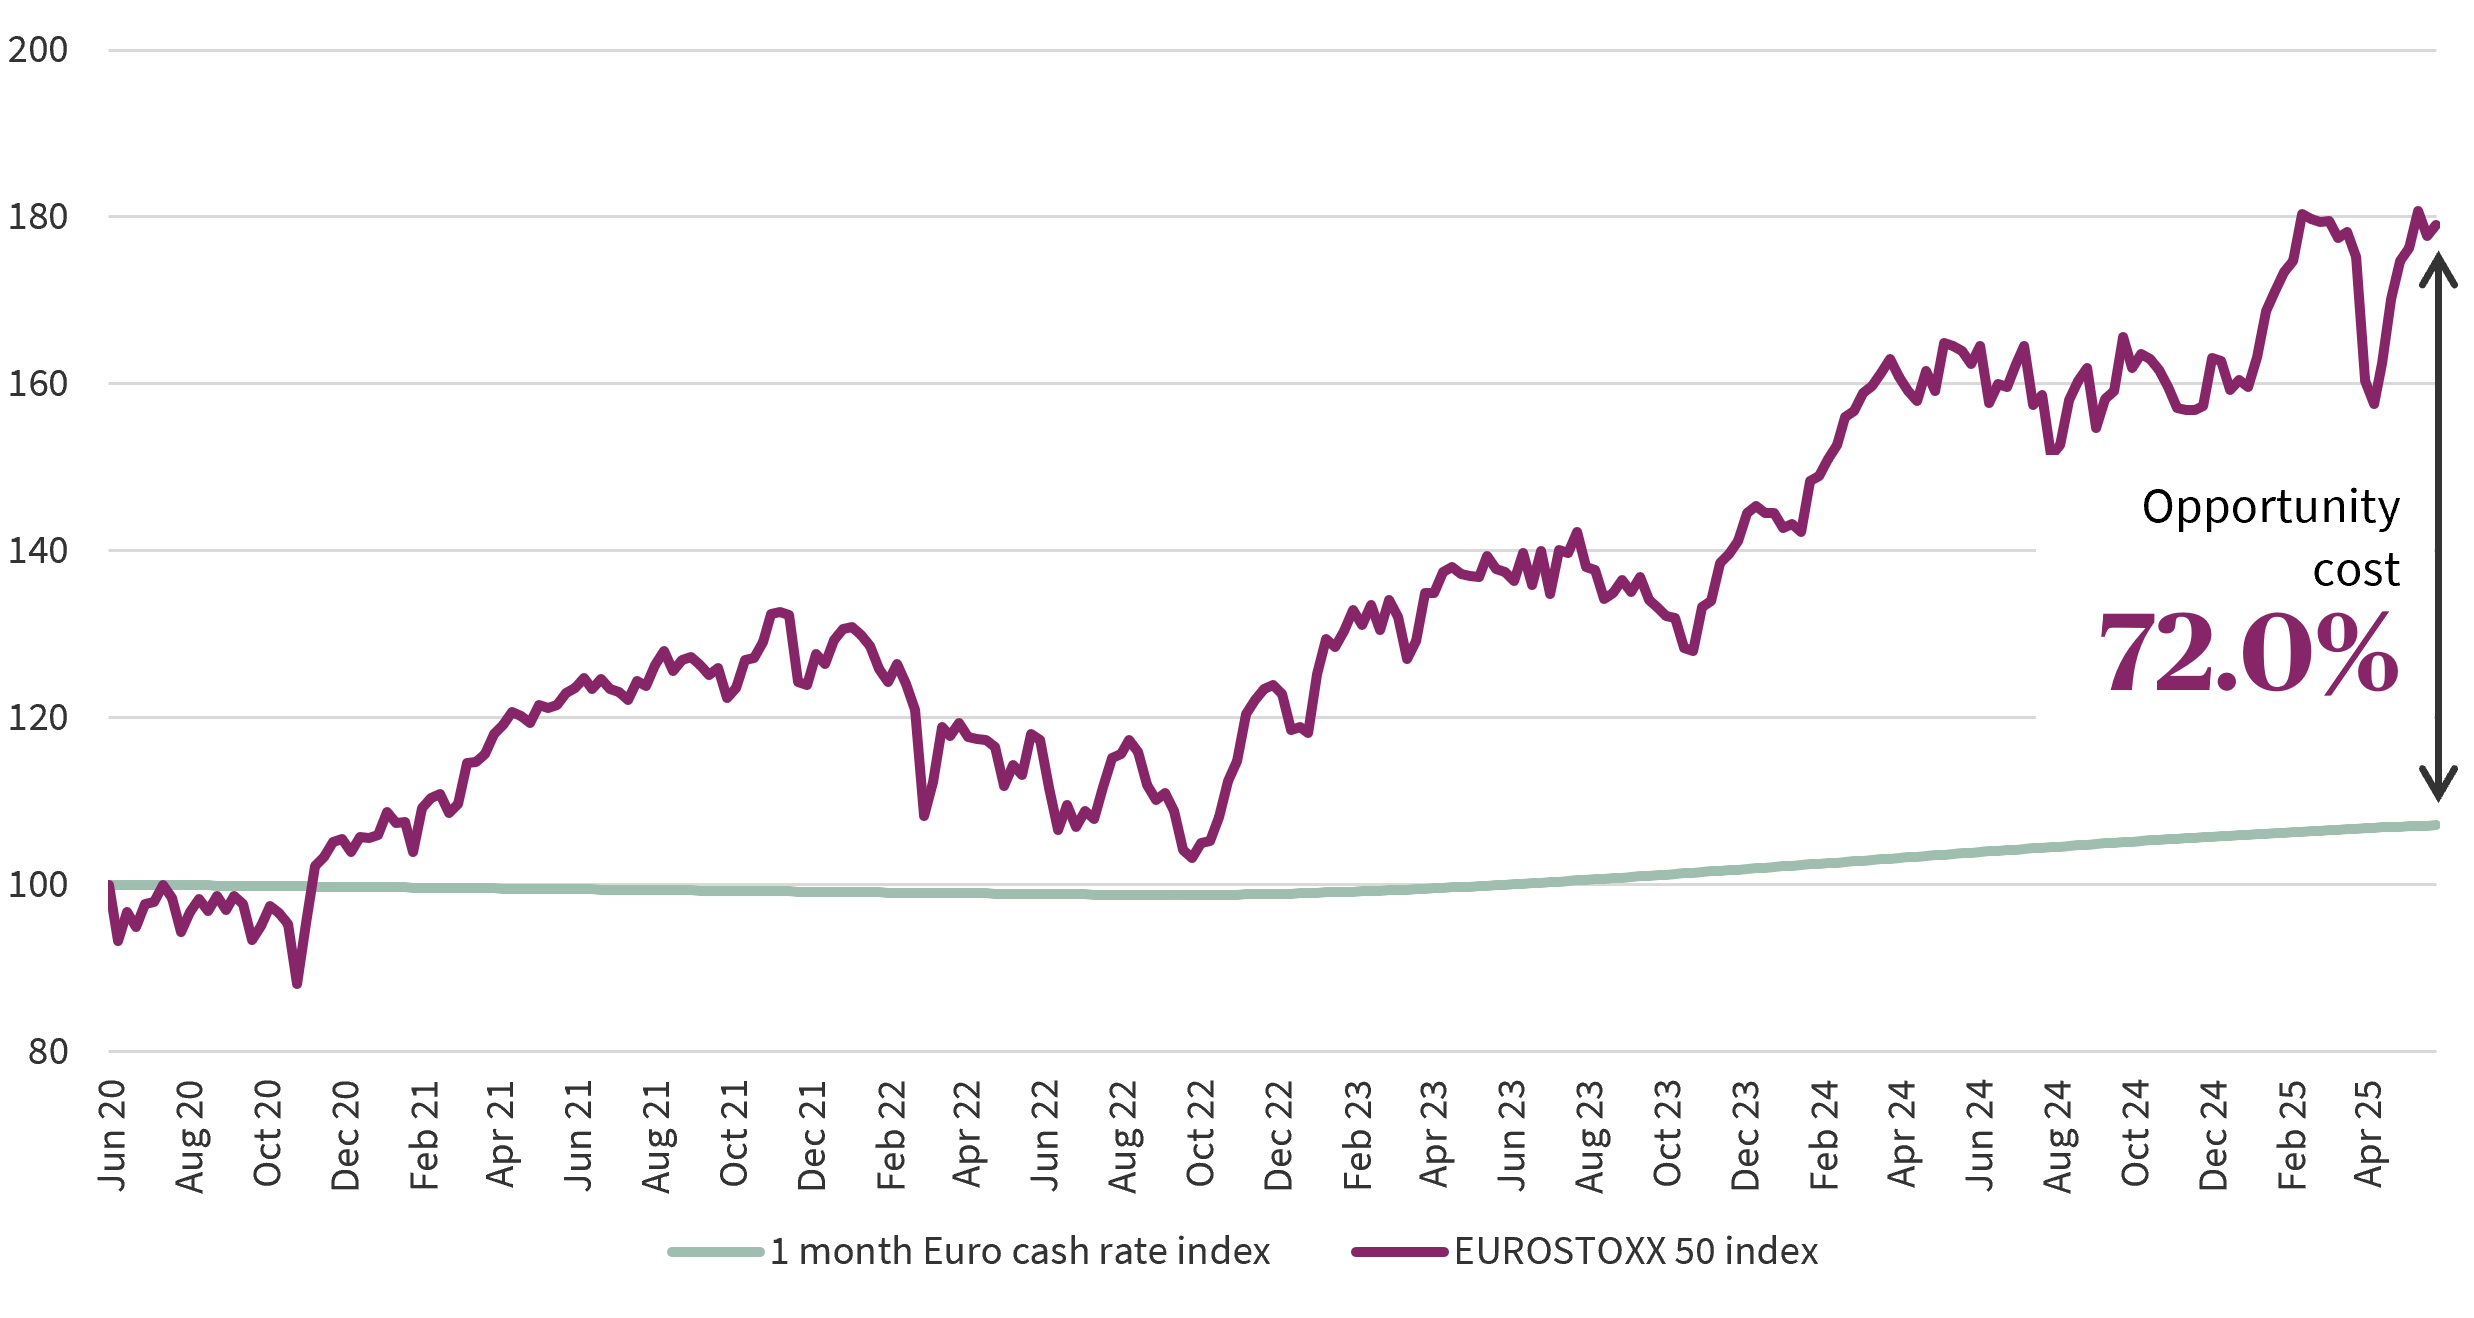
If you put that into a real life context, the below chart shows the opportunity cost of holding cash vs the EURO STOXX 50 Index over a period of 5 years, including even the very painful 2022 sell off as we saw interest rates rise globally. Even with all the volatility, the uplift in potential gain that the investor holding cash has missed out amounts to 72%.
And that is a clear opportunity cost- a missed opportunity to make investment gains.
Past performance is no guarantee of future results. The value and income derived from investments may go down as well as up.
It is fair to say that customers have varying risk profiles and tolerance to risk, but even when you include substantial drawdowns in stock markets, investors seem worse off investing in cash. This is magnified when you extend out the time horizon. To illustrate, below is another chart on how cash compares to other assets over the long term.
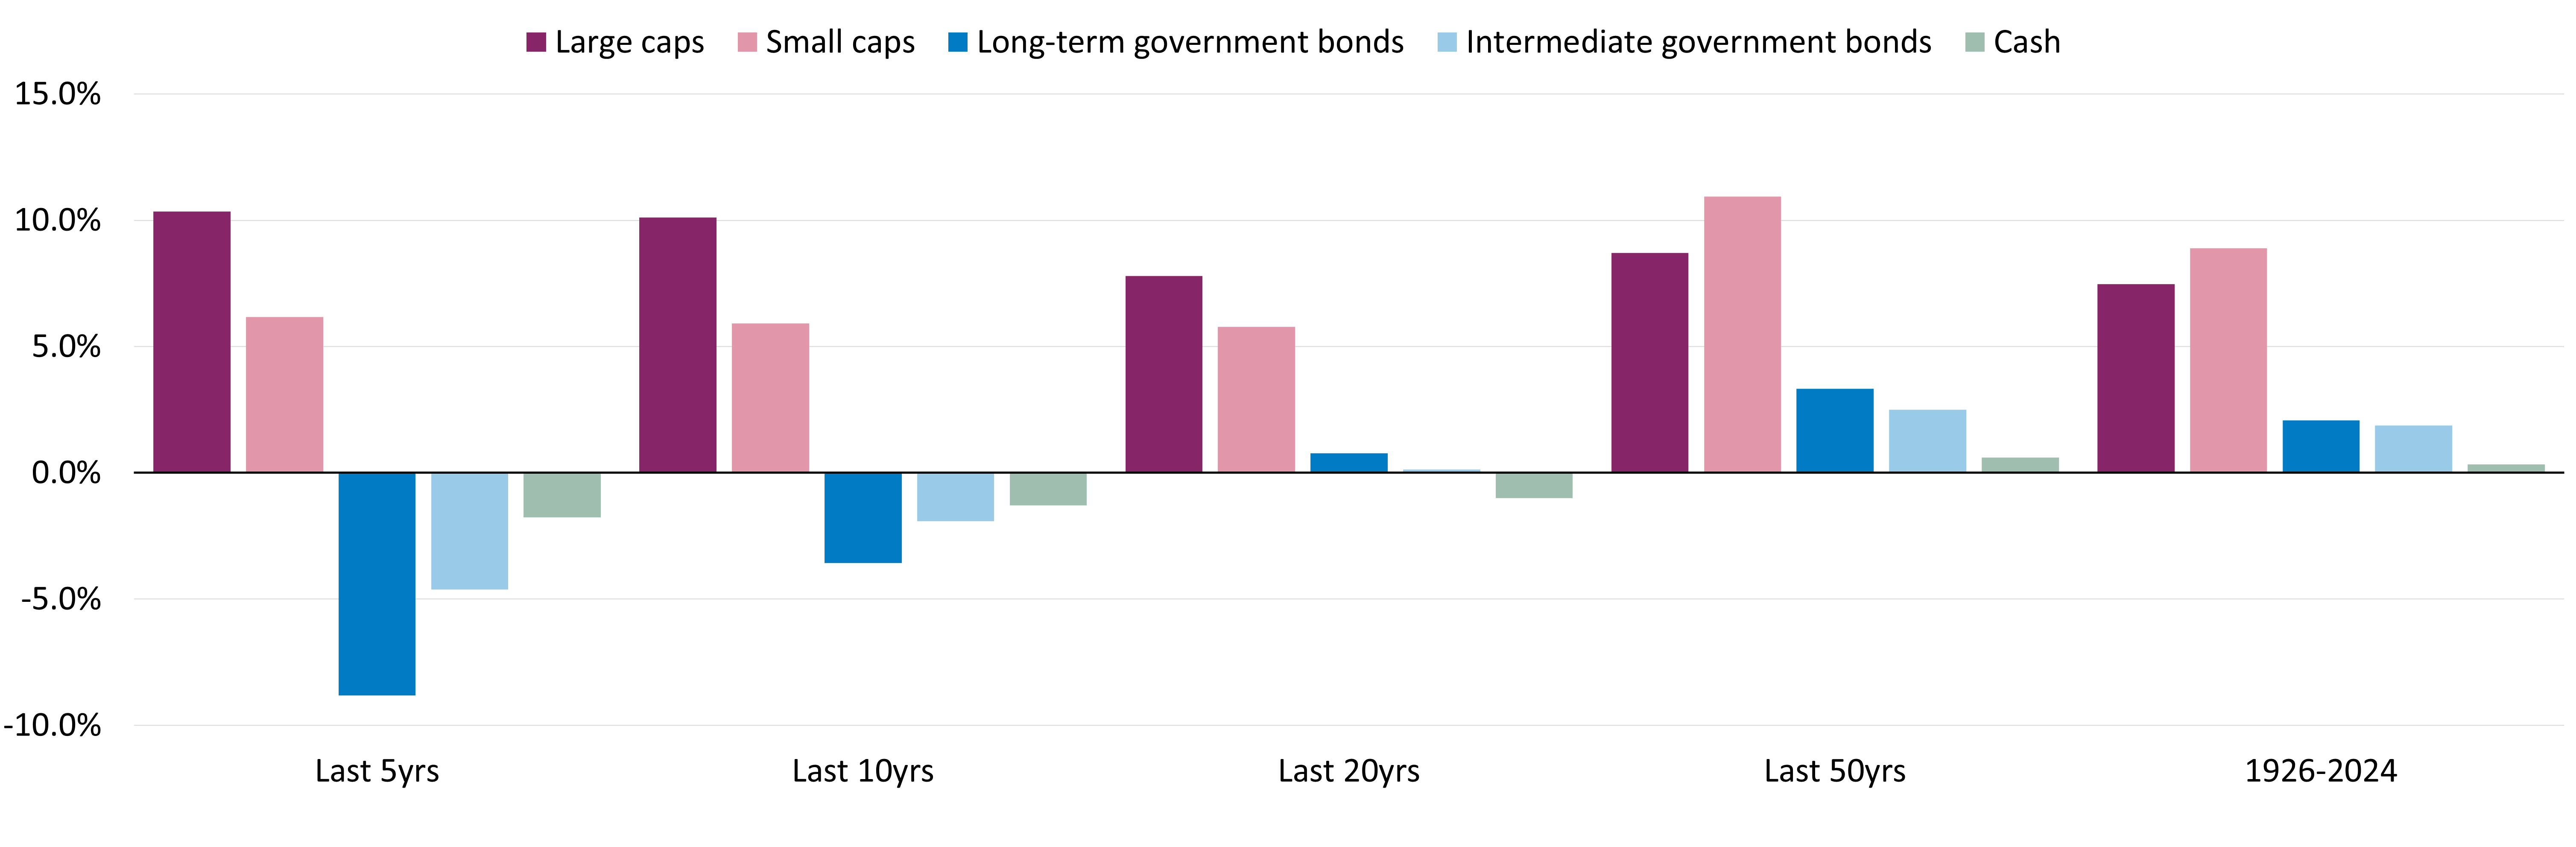
Past performance is not a guide to the future and may not be repeated.
Source: Morningstar Direct, accessed via CFA institute, LSEG Datastream, S&P, Bloomberg, and Schroders. Data to December 2024. 1926-2023: Large caps represented by Ibbotson® SBBI® US Large-Cap Stocks, small caps by Ibbotson® SBBI® US Small-Cap Stock, bonds by Ibbotson® SBBI® US Long-term (20-Year) Government Bonds and Ibbotson® SBBI® US Intermediate-term (5-Year) Government Bonds, cash by Ibbotson® SBBI® US (30-Day) Treasury Bills. For 2024, alternative sources have been used, chosen for consistency with the earlier data. These are S&P 500 for large caps, DFA Micro Cap portfolio for small caps, S&P US Treasury current 20 year index for long-term government bonds, Bloomberg U.S. Treasury Bellwethers: 5 Year index for intermediate government bonds.
How can we rectify this?
No one wakes up in the morning and wants to invest into a fund or a stock or bond. This is a sad statement for me to write, considering my job is to build and sell investments, but I am also one for realism when required!
One factor at play in this lack of interest is financial literacy as only 33% of adults globally are considered financially literate
That the average person has limited understanding of investments should not be a surprise. Investing is complex (even for me!) and personal finance is still not taught in schools at a level that could improve this position. So it is fair to infer that a lack of education could be a contributing factor to irrational decision making.
Regulation can be another. Regulation plays a crucial role in maintaining a balanced and fair society. It protects customers and the environment, provides stability and a fair playing field for competitors. But buying an investment product is not seamless, and when you consider the work required to select an adviser, open investment accounts, carry out Know your Client and Anti-Money Laundering processes, as well as risk profiling and risk acceptance, it can be a deterrent to investment. This is particularly true in a digital world, where people expect outcomes faster than ever. And certainly, not everyone can offer investment products with confidence, especially if they feel they risk tarnishing their customer relationships.
All this points to the need for simple, clear advice. The good news is that there is a market for professional services in managing money! In Europe, discretionary mandates account for approximately 44% of total assets under management
Asset managers, wealth managers, advisers, regulators and governments all have a role to play in both Europe and Asia. Whilst the challenge is huge, I am optimistic when I consider that cash holdings of the average American have consistently been only around the 10-15%