Avoiding locking in your losses
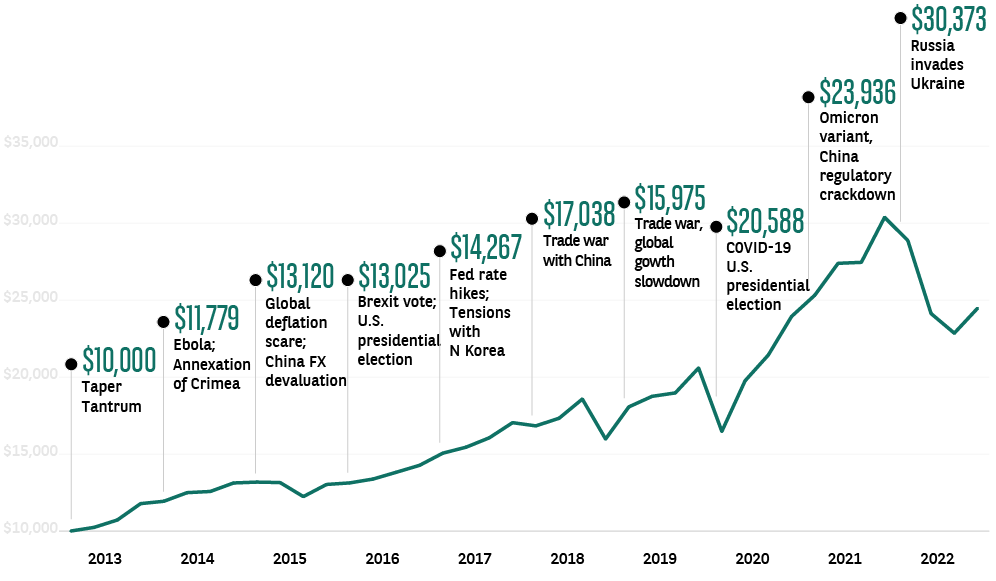
All investors, even the best ones, will at some point own investments that underperform. It is never fun and can sometimes occur when markets are highly volatile and investor sentiment is weak. As the chart below shows, there have been many such occurrences over the past decade, a relatively short period in investing history, but one with more than its fair share of major market moving events. Yet the market also shows a strong ability to recover and move higher, often quite quickly.
Market upsets, market recoveries
Value of $10,000 invested in S&P 500 over the past decade

Bloomberg, JP Morgan AM as at 30 December 2022. This hypothetical example reflects an investment tracking the returns of the S&P 500 Index. It excludes dividend reinvestments and the effects of taxes and inflation.
In time, the ‘market’ (for representative purposes we use the US S&P 500, the largest and most liquid stock market index) has shown persistence in shrugging off concerns that at the time seemed insurmountable. Remember that by selling a holding for less than they bought it for, investors will be locking in losses which are irrecoverable. They will not be able to participate in any subsequent share price recovery unless the decision is made to replace the holding with another bought at a higher level, which may adversely impact their stock and portfolio returns.
Key investment tips
Generating positive returns over the longer term
Research by US broker Charles Schwab covering almost a century’s worth of US market data up to 2011 showed that a 20-year holding period never produced a negative return. More recently, Morningstar’s annual ‘Mind the Gap’ study of returns showed that investors earned a respectable 9.3% on the average dollar invested in funds over the 10 years to 2021. This was 1.7% percentage points lower than the total returns their funds generated over that period. The shortfall is accounted for by poorly timed fund purchases and sales. This effectively cost investors 17% of what they would have earned by not selling.
Time heals
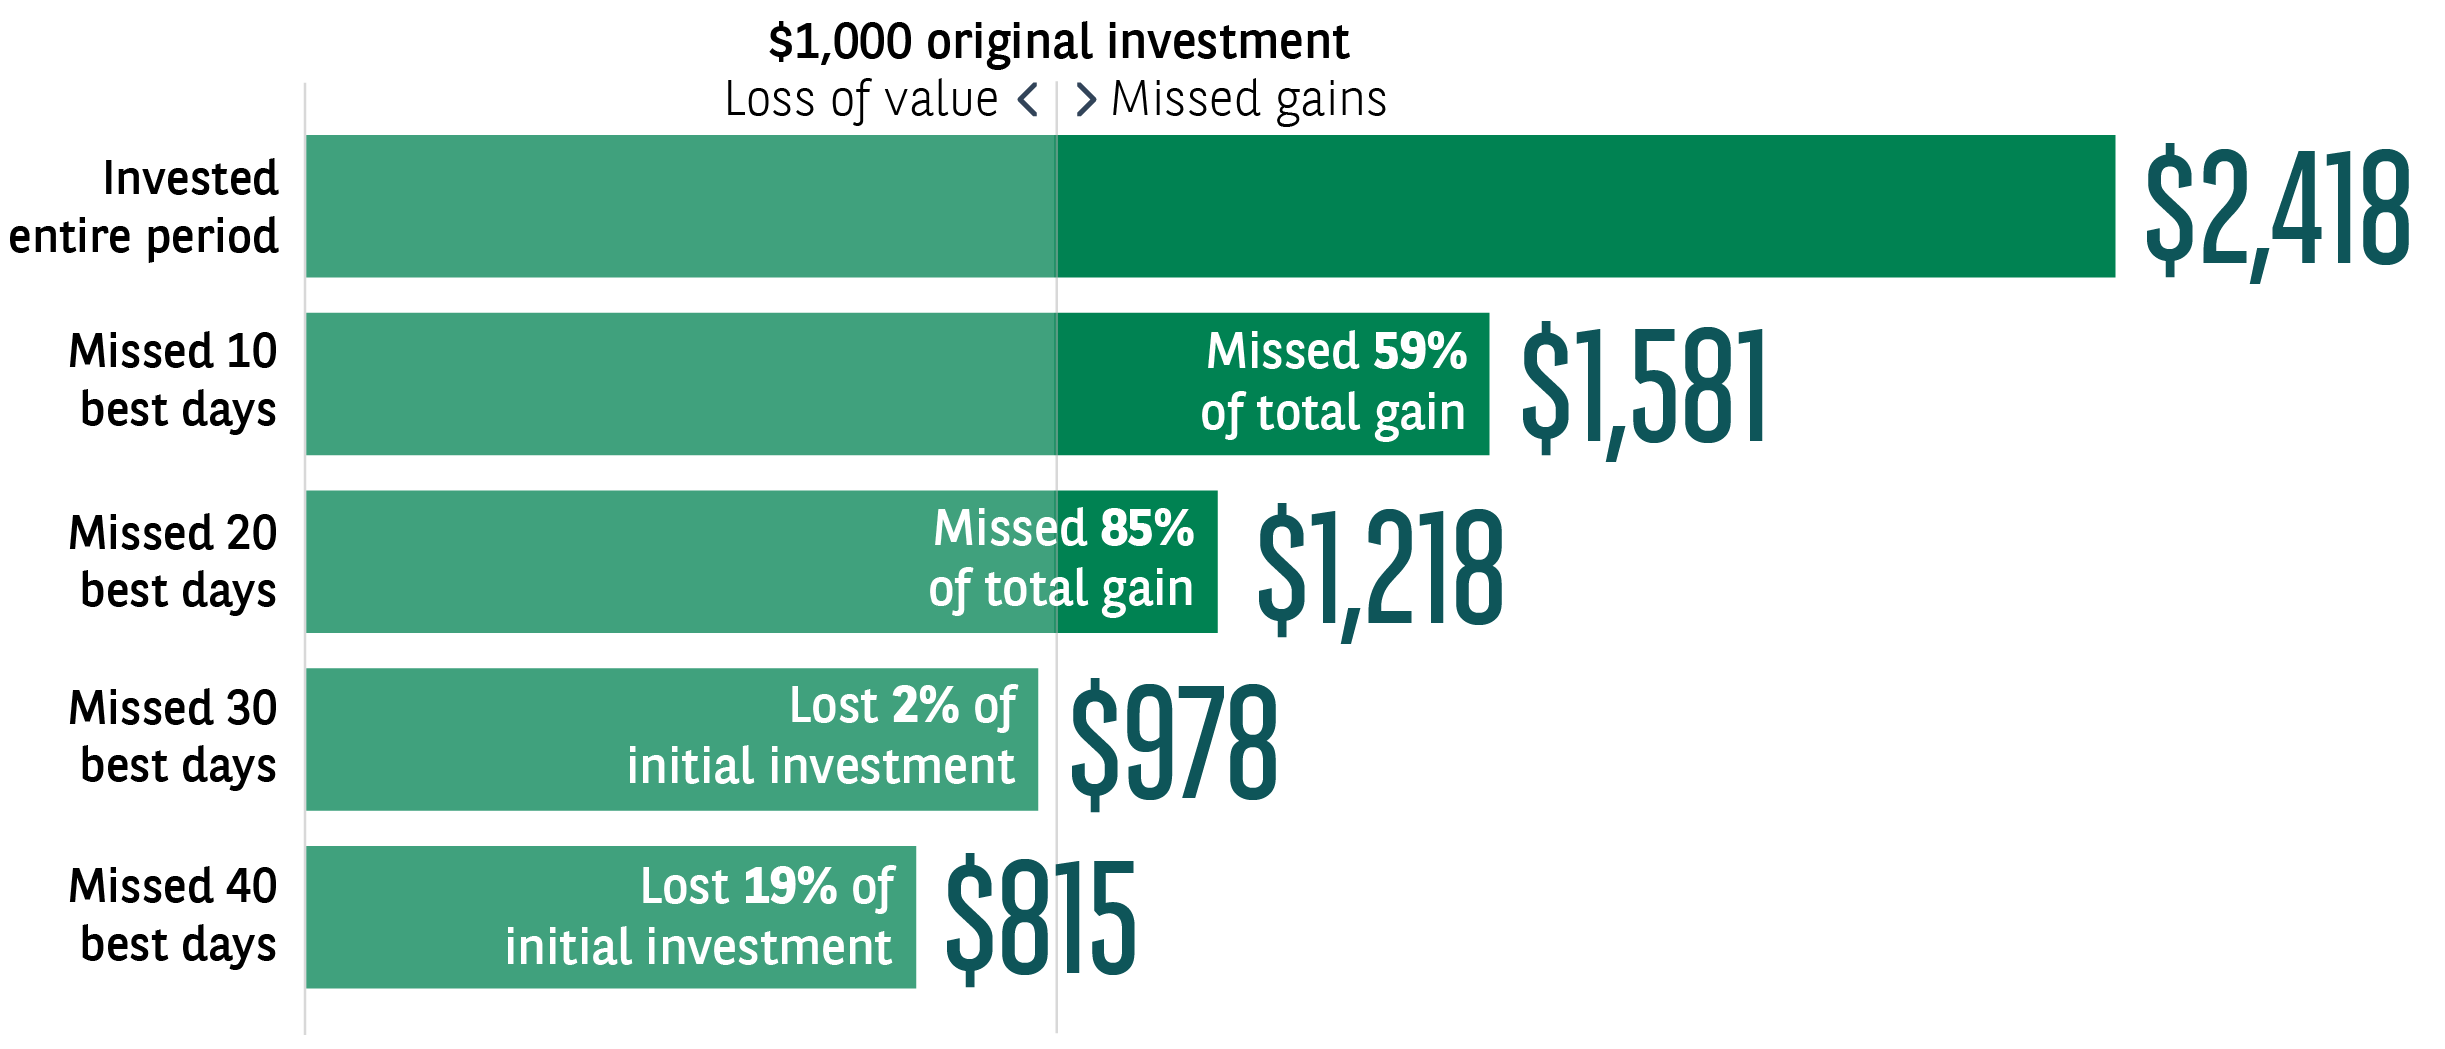
The chart below shows the difference between investors in the MSCI All Country World Index (ACWI) who remained fully invested over the past decade and those who have not. Reinforcing the message that investors are best served by staying in the market, the chart below shows how missing out on a handful of the best return days can have a significant impact on eventual returns. Many of the best performing days occurred close to the worst and so investors selling when the prices are weak have a high chance of missing out when the market recovers.

Sources: RIMES, MSCI, as at 30 December 2022. Value of hypothetical $1,000 investment in the MSCI ACWI, excluding dividends and the effects of taxes and inflation, from 1 January 2013 to 30 December 2022
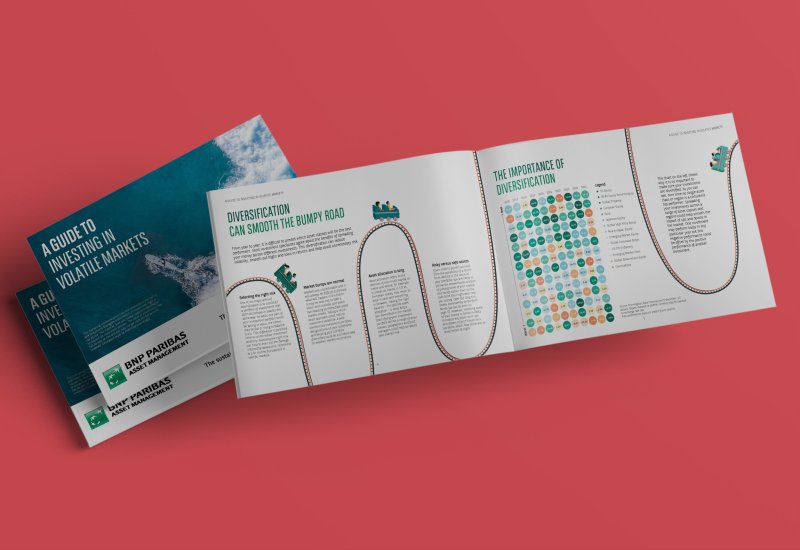
Guide to investing in volatile markets
From the importance of diversifying your portfolio to a five-point investment checklist, this guide highlights what to consider when investing in periods of market volatility.
Download guide