You are using an outdated browser. Please upgrade your browser to improve your experience.
Article | 19 November 2024 | Investments
US equity markets have consistently outperformed other asset classes over more than a decade. The strength of the world’s largest economy, and the strong growth of corporate America, could hold the key to this outperformance. In the years following the Global Financial Crisis, when global economic growth struggled and negative interest rates prevailed, TINA was the watchword. Investors bought US equities believing “There Is No Alternative”. The re-election of Donald Trump as president of the US is likely to reinforce this preference for US equities further. Although valuations are becoming increasingly divorced from earnings growth expectations, as we shall discuss.
It would be hard to dispute that many US companies hold globally dominant positions in growth sectors. Indeed, the Nasdaq 100 index is predominantly compiled of high growth tech companies, with a strong potential for future profits. A number of the biggest growth companies, including some of the ‘Magnificent 7’ mega cap tech stocks, are constituents of both the S&P 500 and the Nasdaq indices. Over the past two years, the US has established leadership in the field of AI (artificial intelligence). This has driven stock market performance ever higher, giving the US markets an even greater valuation premium.

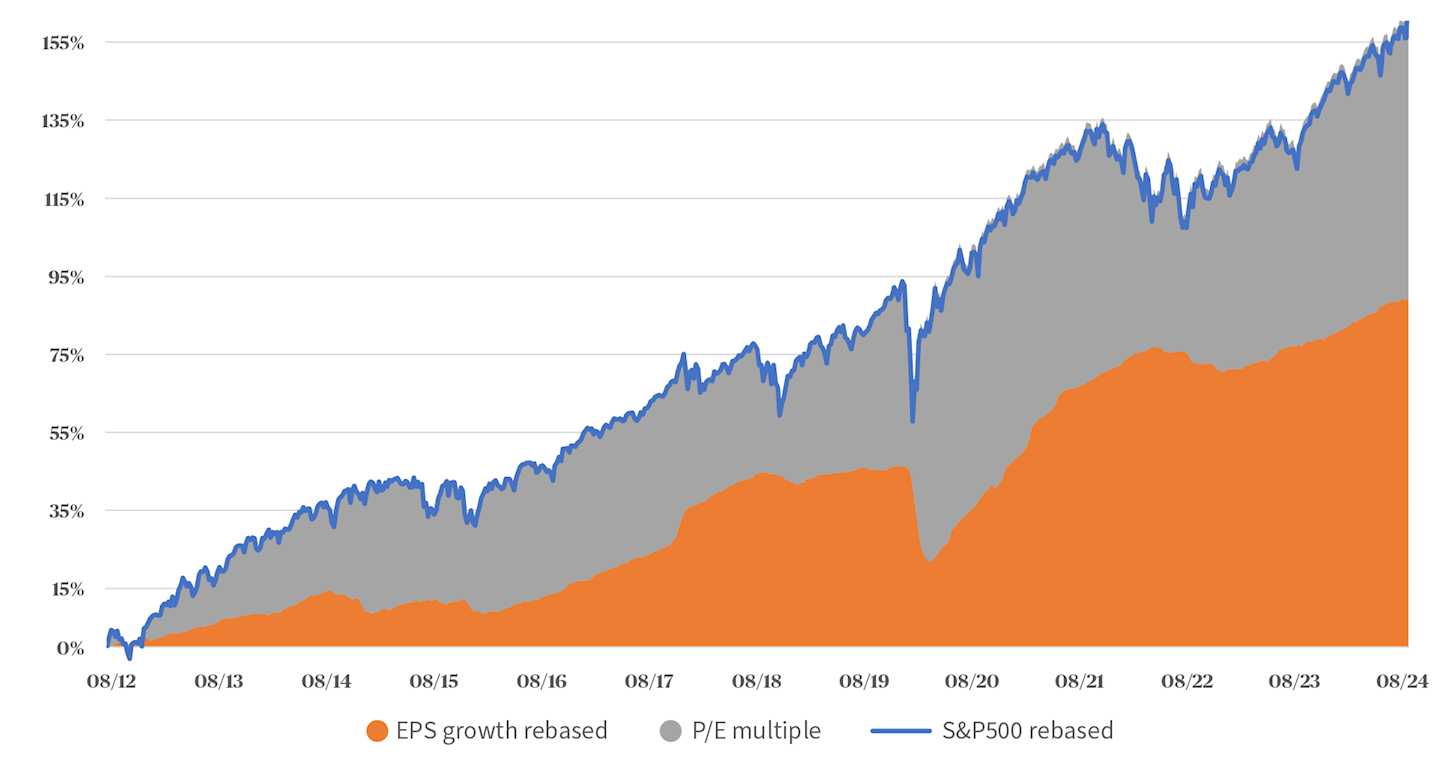
It is instructive to see, in Chart 1 above, the extent to which this year’s performance of the S&P 500 index in blue has outstripped the expected growth in earnings (in orange) for 2024 and is now borrowing most of the expected earnings growth for 2025. Theoretically, over the long term, these two measures might be expected to march hand in hand. The area of the chart shown in grey indicates the extent to which valuations, based on price multiples of earnings, have stretched out over the past 12 years. The chart could be read as an expression of confidence that the US markets will continue to outperform year after year, helped by strong corporate profit growth and the prospect of a supportive Republican administration. But can this expectation be sustained in reality?

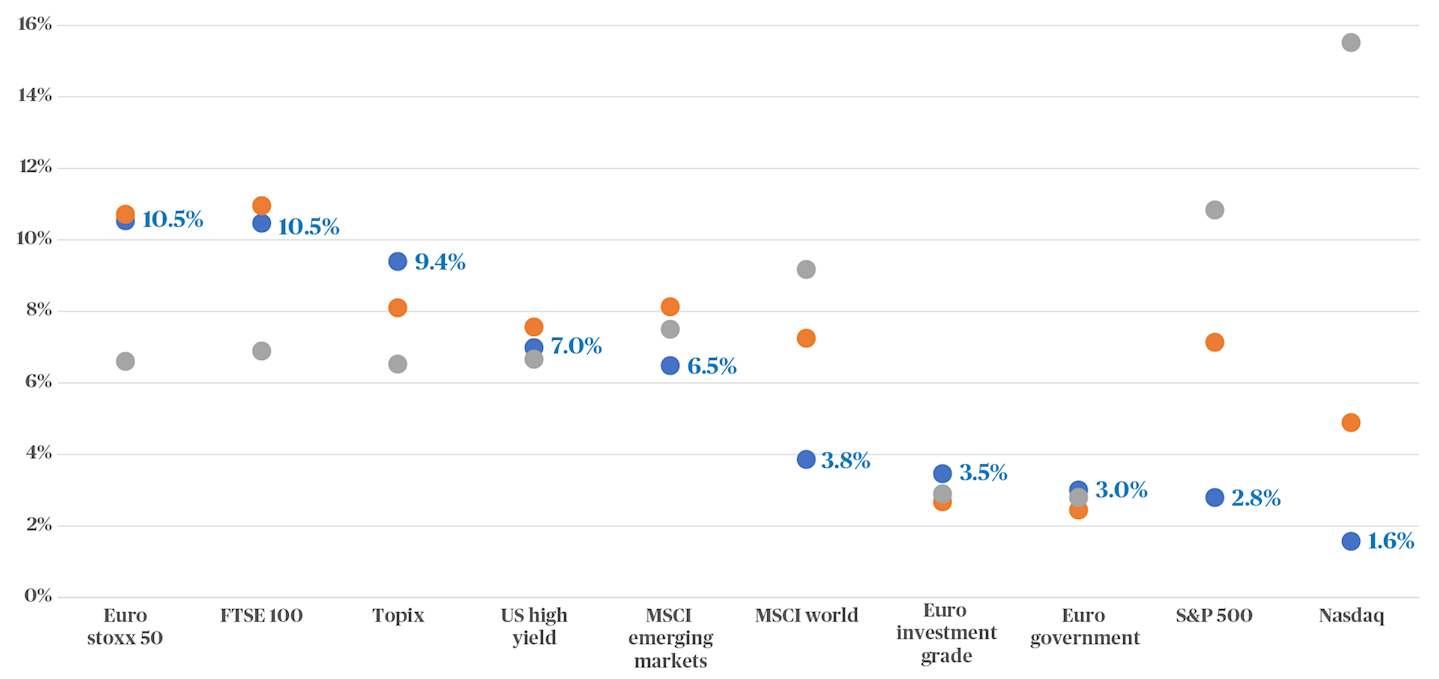
Key:
⬤ : average annualised returns over a 20 year period
⬤ : current risk premium- a proxy for the average expected annual returns over the next 5 years*
⬤ : average of the expected returns over the last 20 years
In Chart 2 above, the grey dots indicate the realised returns from a range of asset classes over a 20 year period. The strength of the S&P 500 and Nasdaq is remarkable. However, the blue dots on the chart represent the expected returns of these asset classes over the next 5 years. The orange dots, meanwhile, show the average value of these expected annual returns over the last 20 years.
In the case of the Euro Stoxx 50, for example, investors expect a return of 10.5% over the medium term, compared to the 6.6% average achieved over the last 20 years. Where the blue dot sits above the orange dot, as is the case for the Japanese TOPIX, the asset class appears to be cheap. And the converse can also be true. The S&P 500 index, with an expected five year return of 2.8% per year against a 20 year average expected return of 7.1%, could not be described as offering good value, although investors are happy to look beyond this metric.
US equities have had a great run over the past decade and are now trading at a considerable premium – around 16% higher than global stocks based on relative price/earnings (PE) ratios. We believe that this is justified by strong US earnings and economic growth, which will likely be boosted by the new Trump presidency, which is fuelling the TINA trade. Sectors such as technology, banking and (traditional) energy are set to benefit from the new administration’s proposed deregulation.
We are adopting an overweight on US equities, which expresses confidence in US “exceptionalism”, while acknowledging that Trump’s political and economic agenda will likely benefit US companies at the expense of European and emerging businesses. Therefore, we are also moving underweight on European and emerging market equities.
*Current risk premia calculated as 1/PER (2025) + dividend yield + share buyback yield – 10y bond yield. Bond risk premia calculated as current yield to worst. Realised risk premia as average annualised total return delivered since Sept 2004, equilibrium risk premia calculated as average current risk premia since Sept 2004.